Although I rarely use their products, I signed up for the free mobile apps from several major BI vendors. Seeing their updates pop up on my Apple iPhone is one way that I can keep up with what’s going on in the industry.
Unlike on-premise software that requires a project plan and an off-hours maintenance window to push into production, mobile software is nearly as easy to update as cloud-based software because the vendor assumes a majority of the upgrade risks. But it seemed to me that SAP was updating their mobile BI app at a much slower rate than their competitors.
To back up my hunch with facts, I built a quick model in Microsoft Excel using product versions and release dates from the Apple iTunes store and loaded the data into SAP BusinessObjects Lumira.
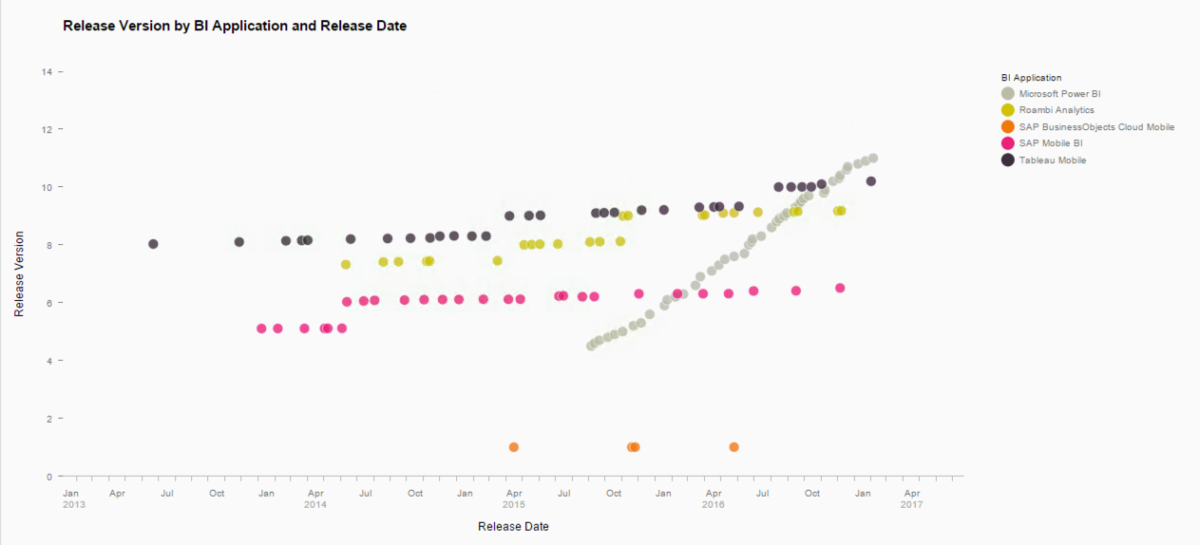
As you can see in the chart below, Microsoft clearly updates their Power BI mobile app at a frequency greater than SAP BusinessObjects Mobile BI or even (gasp!) Tableau Mobile (click images to enlarge).
Microsoft Power BI, a recent entry into the BI marketplace, was introduced on July 24, 2015 and has been on a rapid release schedule ever since. The Apple iTunes store had release history going back to September 5, 2015 and contains 44 releases through February 2017. Oh sure, many of the releases contain only “bug fixes” or “performance enhancements,” but so do many of the releases from Microsoft’s competitors.
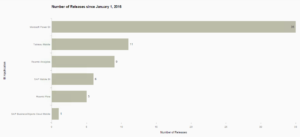
Since January 1 of last year, Microsoft has updated their Power BI iOS app a whopping 35 times. Contributing to most SAP users’ Tableau envy, Tableau updated their iOS app 11 times, almost twice as many updates as SAP’s.
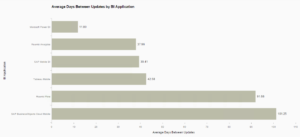
Microsoft releases a new version of Power BI for iOS on an average of every 12 days. SAP actually beats Tableau on this metric, releasing a new iOS version every 39.41 days to Tableau’s 42.58 days.
These are quantitative measurements and one could certainly argue that Microsoft’s numbers are padded with frequent “bug fix” updates that don’t introduce any new functionality. In terms of qualitative measurements, which are a bit more subjective, only Microsoft Power BI has a native interface for the Apple Watch. Not even Tableau can boast that. And only Microsoft Power BI boasts “conversational BI” with the ability to ask questions about data in plain English.
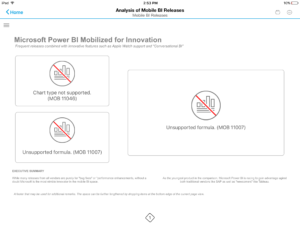
Ironically, none of the three Lumira charts I prepared for this article could be viewed on my Apple iPad, even though I’m using the latest versions of SAP’s BI platform and mobile app.
The SAP Mobile BI team is likely hard at work preparing updates to support the forthcoming Lumira 2.0 release. Or perhaps they’ve been reassigned to help roll out a new version of the separate SAP BusinessObjects Cloud mobile app. Or both. But I hope SAP will be able to increase the release frequency and deliver bigger analytic innovations in its core Mobile BI app.
Related articles
- Announcing Power BI general availability coming July 24th (from the July 10, 2015 Microsoft Power BI Blog)
- Announcing Power BI integration with Cortana and new ways to quickly find insights in your data (from the November 30, 2015 Microsoft Power BI Blog)
- iOS Apple Watch Mobile Support (from a January 15, 2017 Tableau Community post)
- Ask questions about your data in the iOS mobile apps (from the February 3, 2017 Microsoft Power BI Blog)
Don’t think you can currently use Lumira on Mobile BI, but Design Studio does work.
The last two updates to SAP BusinessObjects Mobile BI for iOS (6.4.x and 6.5.x) introduced Lumira 1.3x support; however, it is limited. I expect a different approach from SAP when they introduce Lumira 2.0.
Dallas – Even though Power BI has frequent releases, it’s intent is performance boost or bug fixes, which to me indicates how “unstable” of a product is Power BI that it has to undergo changes every x number of days.
Say whatever about SAP BI in comparison, I think it depicts a lot more stability in its code base and introduces releases when warranted.
Farid