Two years ago, I took a look at the Mobile BI samples in BI 4.0 (see related article, Sampling the Mobile BI Samples with BI 4.0). Those samples were focused on older mobile devices like the Blackberry and not newer devices like Apple iOS and Google Android phones and tablets. Today, SAP includes tablet-ready samples as part of SAP BusinessObjects Business Intelligence 4.1 (also in later support packs of BI 4.0), but you’ll need to complete a few simple tasks to see these reports on your mobile device.
Take a look in the Web Intelligence Samples folder and look in the Mobile Samples subfolder.
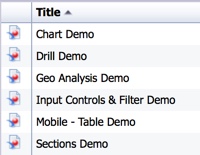
Inside are six reports: Chart Demo, Drill Demo, Geo Analysis Demo, Input Controls & Filter Demo, Mobile – Table Demo, and Sections Demo.
Many of these reports look pretty plain in the BI Launch Pad, but they come to life on a mobile device. Out of the box, the documents won’t show up on a mobile device because the categories required by the Mobile BI app do not exist. So take a couple of minutes to create the categories (see related article, Creating Categories for SAP Mobile BI Documents). Next, tag each of the six mobile samples with the Mobile category (at first glance, none of the samples fared better with MobileDesigned, but feel free to compare these two categories yourself).
With the category applied, you should now be able to see these Web Intelligence documents on your mobile device. I’m using my trusty Apple iPad 2 and SAP BusinessObjects Mobile BI 6.1.9 (the most recent release) and SAP BusinessObjects Business Intelligence 4.1 SP5. Keep in mind that both the version of the mobile app and the version of the BI platform can affect how Web Intelligence documents are displayed.
Chart Demo
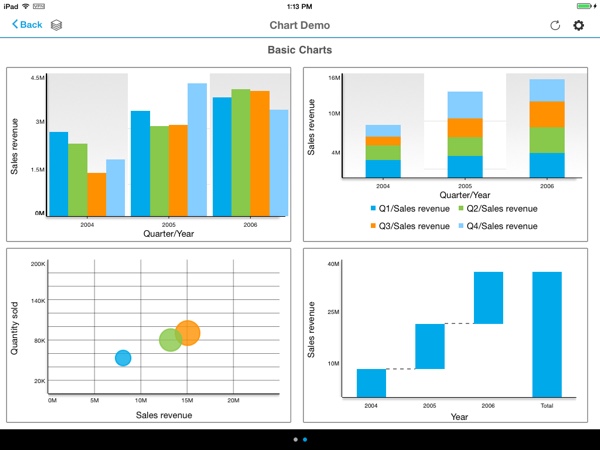
The Chart Demo demonstrates how various charts using the new BI 4 visualization engine (aka CVOM) appear on a mobile device. There’s several reports within the Chart Demo document- I’ve chosen one of the more colorful ones here. Notice the bubble and waterfall charts, which we never had in XI 3.1 or earlier.
Drill Demo
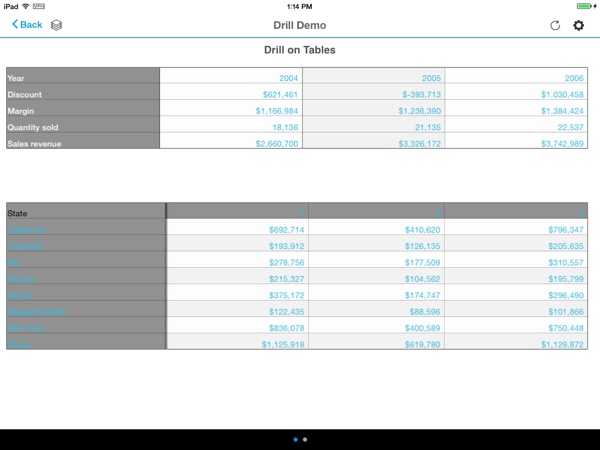
The drill demo demonstrates how to drill down with tables.
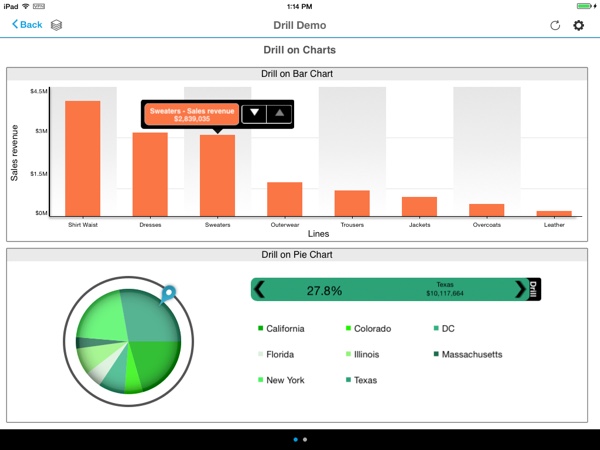
It also shows how to drill down with charts. Clicking on a column of the top chart…
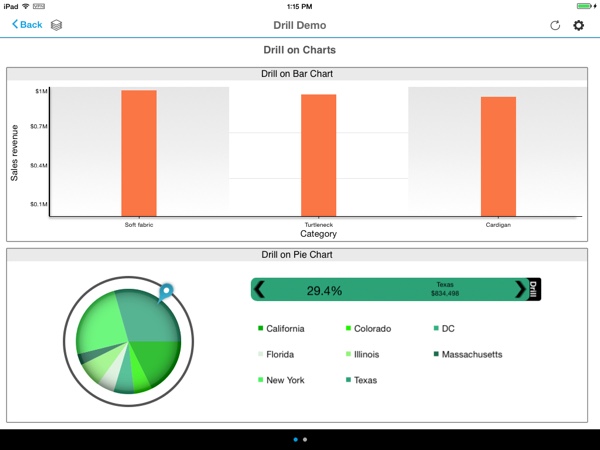
…causes it and the pie chart beneath to drill to the next level of the hierarchy.
Geo Analysis Demo
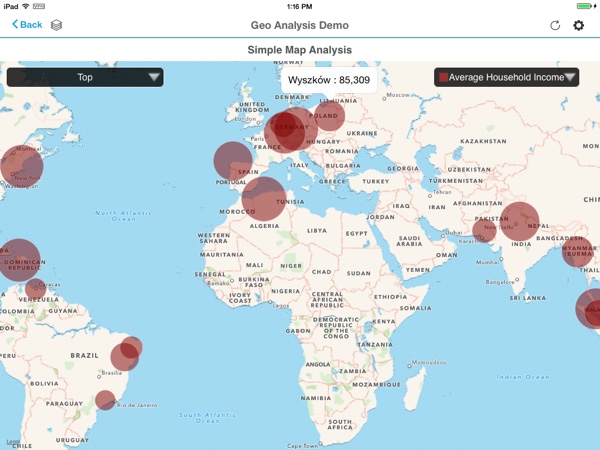
The Geo Analysis Demo demonstrates how to visualize multiple metrics by latitude and longitude. Mapping is only available on a mobile device- this report looks like a bunch of boring tables in the BI Launch Pad.
Input Controls & Filter Demo
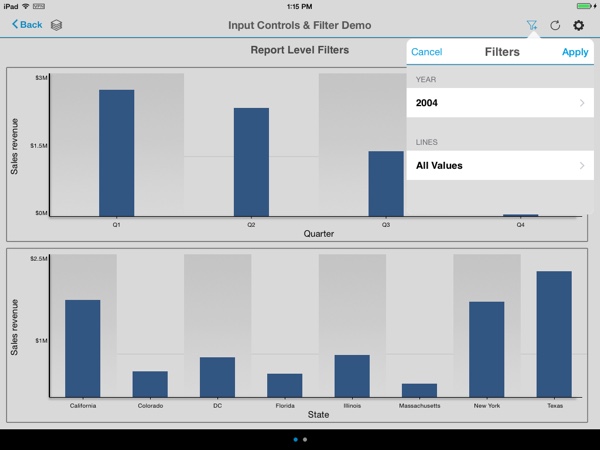
As the name suggests, the Input Controls & Filter Demo demonstrates how input controls and filtering are very nicely supported via the mobile interface.
Mobile – Table Demo
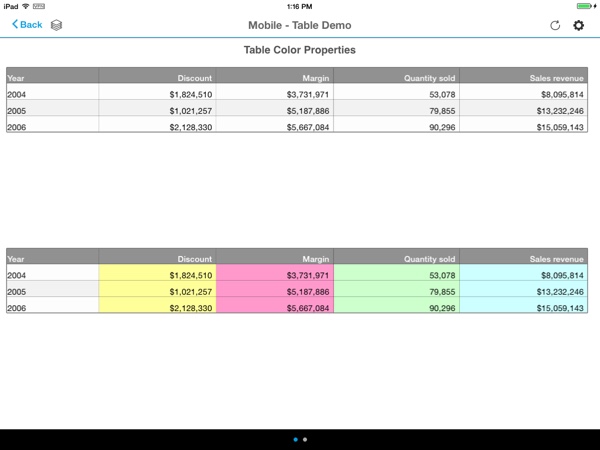
The Table Demo demonstrates how horizontal, vertical and crosstab tables appear on a mobile device. There’s multiple report tabs showing various capabilities- I chose the most colorful one here.
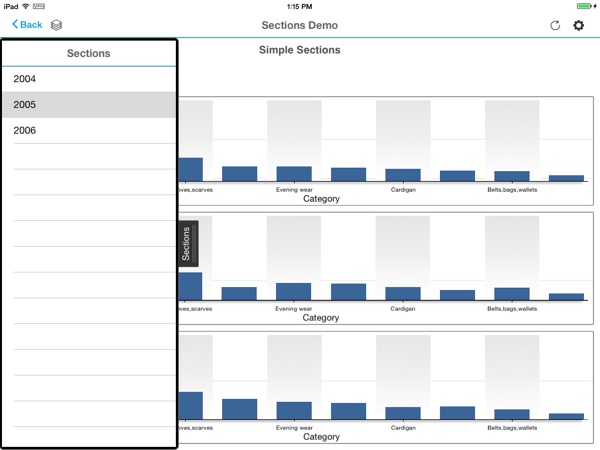
Sections Demo
Just a simple report showing how the mobile user experience allows users to navigate sections.
These screen shots only show a fraction of the features SAP has demonstrated with these six samples. I was a bit surprised that there’s no bullet graph in these samples and I hope that SAP will continue to enhance this mobile-ready collection in future releases.
SAP has really done mobile-curious customers a big favor with such a useful starting point. Don’t forget that the mobile app itself has its own samples. But these samples effectively demonstrate what a Web Intelligence developer needs to do. I hope you’ll be encouraged to use the same techniques in your own mobile-ready Web Intelligence reports.
Are you currently using mobile Web Intelligence? I’d love to hear any success stories.



Hi Dallas, nice blog
I’m using BI Mobile with webi on BW query. When i apply a filter with the input control, a refresh of data occur from BW.